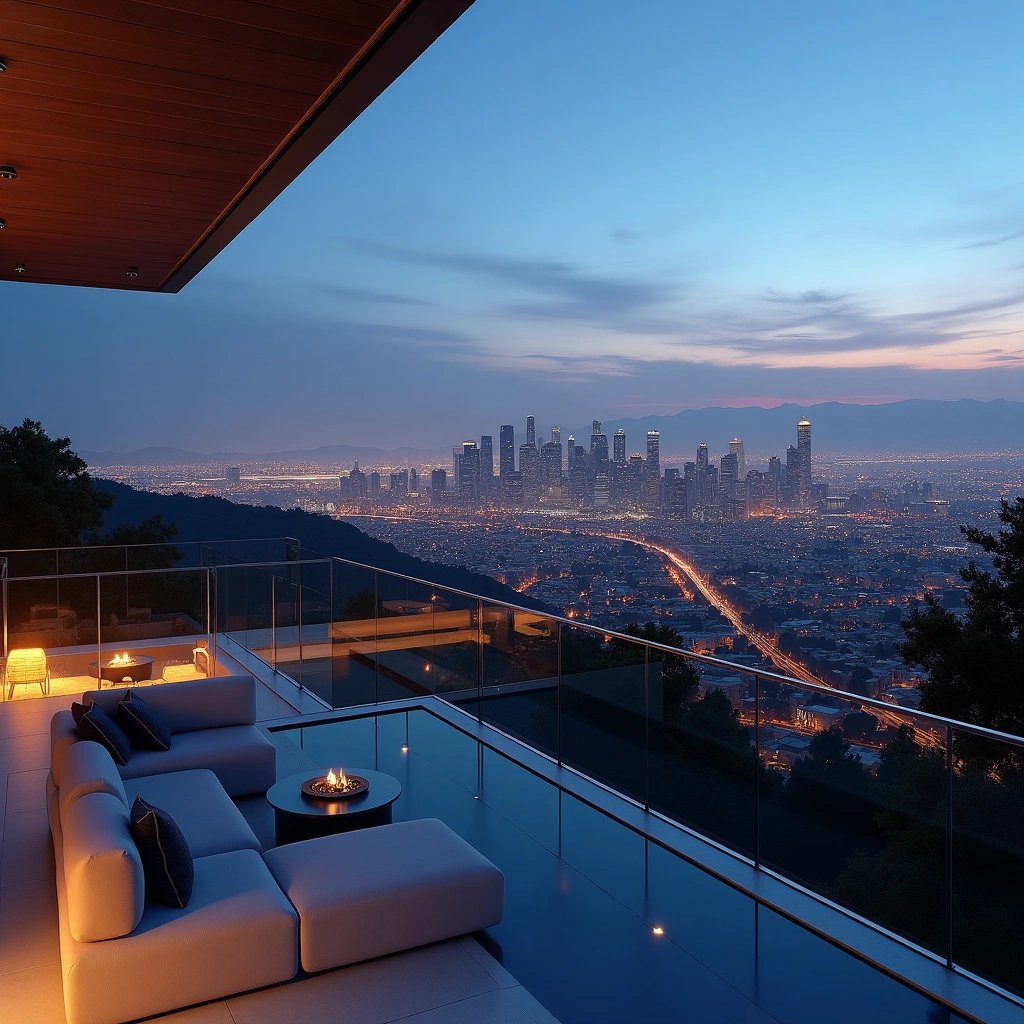
![Most Affluent Neighborhoods in Los Angeles: Palisades vs Hollywood Hills vs Bel Air Investment Guide [2026]](https://media-production.lp-cdn.com/cdn-cgi/image/format=auto,quality=85,fit=scale-down,width=1280/https://media-production.lp-cdn.com/media/00c31f72-2e85-4d0b-a09e-ce60bf90794f)
The most affluent neighborhoods in Los Angeles operate through channels most buyers never see. Properties in rich neighborhoods rarely enter the public market. Private sales between connected parties create transactions that maintain exclusivity and discretion. Pacific Palisades commands median values around $5.5 million. Beverly Hills Gateway reaches nearly $13 million[-2], while Hollywood Hills offers comparatively available entry at $1.849 million. These wealthy neighborhoods in Los Angeles represent distinct investment theses. Each market delivers different cap rates and appreciation patterns that just need careful analysis before commitment.
Why These Three Affluent Neighborhoods in Los Angeles Operate Differently
Luxury real estate in Los Angeles operates through private conversations rather than public listings. Timing matters more than visibility in markets where discretion carries equal weight with financial capacity. The richest neighborhoods in Los Angeles function within a parallel ecosystem where transactions unfold through trusted networks, shaping value in ways standard markets never experience.
How Off-Market Transactions Shape Value in Elite Markets
Off-market sales dominate the upscale neighborhoods in Los Angeles at rates that alter pricing dynamics. The National Association of Realtors estimates roughly 1 in 5 U.S. luxury homes sold privately off-MLS in 2023. This proportion climbs higher in international markets. One-third of £1 million-plus homes in the UK changed hands off-market in 2023. Properties exceeding £2 million show even greater private transaction rates, with 54% of £5 million-plus properties finding buyers without any public advertising.
High-end brokerages report a 25% increase in off-market questions from high-net-worth clients in the last five years. Approximately 20% of all transactions occur off-market in Los Angeles luxury markets. These properties start at $20 million and above, creating a distinct tier where standard market exposure never applies.
The pricing advantage flows both ways but works differently than public sales. Sellers gain flexibility to test price points without accumulating visible days on market. Feedback that suggests adjustments allows them to modify asking prices quietly rather than suffering public price cuts that signal distress. Properties listed on MLS sell for 13% more than those sold privately according to combined data. Many sellers accept this potential discount to avoid public scrutiny. The calculation balances financial returns against privacy value and timing control.
The Role of Privacy and Discretion in Wealthy Neighborhoods in Los Angeles
Privacy drives the off-market preference in most expensive neighborhoods in Los Angeles more than any financial thought. High-profile buyers and celebrities need anonymity that public listings cannot provide. Security concerns escalate when addresses become widely known. Estate sales during divorce proceedings or business liquidations need confidential handling that prevents public speculation.
Sellers working through private channels control who receives property details. They often require NDAs before sharing information. They approve each showing and limit the buyer pool to vetted, qualified prospects. This curated approach prevents the disruption of open houses and unqualified questions that accompany public listings.
Status thoughts reinforce privacy motivations. Access to hidden inventory functions as exclusive club membership among the ultra-wealthy. Buyers who gain early knowledge of off-market opportunities notice this as privileged insider access. This creates psychological appeal that can accelerate decisions and strengthen offers. The exclusivity itself becomes a selling point, making properties more desirable by keeping them less visible.
What Drives Consistent Appreciation in Most Expensive Neighborhoods in Los Angeles
Appreciation in wealthy neighborhoods in Los Angeles follows different logic than standard housing markets. Bel Air maintains home values per resident at $2,035,000, yet its eight-year appreciation of 61% ranks only No. 68 among county neighborhoods. High baseline values limit percentage growth compared to areas with lower entry points.
The appreciation that does occur stems from structural lack rather than market cycles. Limited inventory in affluent neighborhoods in Los Angeles creates natural supply constraints. Many properties in wealthy enclaves never enter the market. Private sales between connected parties maintain neighborhood prestige through discrete exchanges. These transactions often close at premium prices because they offer privacy from public scrutiny.
Global need insulates elite markets from regional downturns. Buyers from Asia, Europe and the Middle East view Los Angeles luxury real estate as both status symbol and investment harbor. All-cash transactions from foreign purchasers eliminate financing contingencies and maintain transaction velocity even during credit contractions. Architectural significance from designers like Paul Williams and Richard Neutra creates cultural value that surpasses short-term market trends, establishing valuation floors that rarely decrease.
High-net-worth individuals approach property acquisition for legacy rather than immediate returns. They maintain multiple residences and can time purchases without financial pressure, creating patient capital that supports stable pricing whatever broader economic indicators show.
Pacific Palisades: Coastal Serenity Meets Investment Stability
Pacific Palisades blends coastal geography with investment resilience that survives market disruptions other neighborhoods cannot endure. January 2025 fires destroyed over 7,000 housing units and moved the market into a recovery phase that continues to redefine value. Properties that survived trade at price points reflecting both lack of supply and renewed buyer need for location over short-term volatility.
Current Property Values and Market Positioning
Median listing prices sit at $3.70 million as of March 2026, down 40.37% year-over-year following fire-related inventory loss. Average sale prices dropped from $3.60 million pre-fire to $2.40 million, a 33% decline that created rare entry opportunities in a market that was insulated historically. January 2026 transactions averaged $3.14 million across 58 closed sales. Four Riviera properties exceeded $10 million and one Huntington transaction hit $13.50 million.
Active inventory remains 60% below its pre-fire five-year average as of Q1 2026. The 316 homes listed currently include untouched properties on eastern and coastal edges, plus cleared lots with secured rebuild permits. Vacant land prices range between $1.10 million and $2.80 million depending on size, location and permit status. Ridge lots with ocean views that were expensive before the fire now attract serious attention. Cleared land with approved permits represents a generational entry point.
Architectural Styles and Estate Characteristics
Mediterranean architecture dominates with red-tiled roofs, stucco exteriors and courtyard-centered layouts that provide privacy while connecting indoor and outdoor spaces. Craftsman homes feature exposed beams, overhanging eaves and columned porches that showcase hand-carved wood details. Modern estates emphasize geometric forms and floor-to-ceiling glass that flow from interior rooms to outdoor patios.
Retractable glass walls, infinity pools positioned to mirror ocean views and outdoor kitchens with built-in grills define current luxury standards. Smart home automation via Savant systems, biometric access control and solar-integrated roofs with battery storage reflect what high-net-worth purchasers expect.
Buyer Profile: Who Invests in Pacific Palisades
Three groups drive 2026 acquisitions. Former residents return with insurance proceeds and strong motivation to re-establish community roots. Out-of-area buyers recognize the combination of location prestige and lower entry points on lots compared to historical norms. Investors and builders with capital buy land to build and sell finished homes into the premium tier.
Corporate entities purchased 23 of 58 January 2026 transactions, representing roughly 40% of sales activity. This mirrors broader patterns where investors acquired approximately 40% of vacant lots in fire-affected ZIP codes during Q3 following the fires.
Cap Rates and Cash Flow Expectations (4.5% to 5.5%)
Multi-family investors in Los Angeles now purchase properties with 5-7% cap rates, a move from 4% averages in prior years. Vacancy rates dropped to 4.8%, the lowest in over 20 years, while rent growth averages between 2.3% and 3.5%. Pacific Palisades rent forecasts predict 8-12% increases through 2025 due to the destruction of approximately 7,000 units.
Risk Factors: Fire Zones and Insurance Considerations
Insurance premiums increased 35-50% post-fire. FAIR Plan coverage is now required for many properties where conventional carriers withdrew. Annual FAIR Plan premiums range from $30,000 to $60,000, factored into carrying cost calculations by buyers before making offers. All homes in Pacific Palisades except one face major fire risk according to First Street climate research. Transactions need fire clearance documentation, hillside grading review and permit status diligence that makes Pacific Palisades among the most technically demanding markets in Los Angeles.
Hollywood Hills: View-Driven Value and Topography Challenges
Hollywood Hills pricing reflects negotiation power that moved decidedly toward buyers since late 2024. The median listing price stands at $1.849 million as of February 2026, yet homes sold 4.21% below asking on average. Zillow reports a median sale-to-list ratio of 0.966, with 73.7% of sales closing under list in February 2026. This creates entry opportunities in one of the most affluent neighborhoods in los angeles where access had previously required substantially higher capital.
Price Entry Points and Market Accessibility ($1.8M to $50M Range)
Average home values reach $1,954,984, while median sale prices settle at $2,073,333 in 325 active listings that average 87 days to pending as of March 31, 2026. Entry-level properties between $900,000 and $1.5 million feature older 2-3 bedroom homes on hillside lots with limited views or deferred maintenance. The mid-range tier from $1.5 million to $3 million captures mid-century modern homes and updated canyon bungalows with partial city views. Luxury homes from $3 million to $7 million demand architectural pedigree and panoramic views across both the Basin and Valley.
Properties above $10 million operate under different market mechanics. A $10 million budget secures between 4,500 and 7,000 square feet with features that include historic post-and-beam designs and modern hilltop residences with elevator access. Premium properties command twice the median price per square foot of $824. Unobstructed city views and privacy levels push these prices higher. The ultra-luxury segment maintains velocity through all-cash buyers and global investors who eliminate financing contingencies.
The Bird Streets and Premium Micro-Markets
The Bird Streets sit on a ridge north of the Sunset Strip in the 90069 area, known for celebrity ownership and architect-led homes. Entry opportunities range from low $3 million to $6 million for smaller non-view properties, while renovated homes with reliable city or canyon views trade between $6 million and $20 million. Trophy estates on prime promontories with skyline plus ocean views command $20 million and above. One recent Bird Streets listing reached $63 million for a 15,600-square-foot estate with eight bedrooms and unobstructed Pacific Ocean sightlines.
Lots trend steep and terraced, narrow at the street. Flat buildable pads command premiums. The most valuable parcels occupy promontories or flag lots with long, unbroken sightlines across the basin to the ocean. Average home prices in the Bird Streets reach $13.16 million, with average sold prices near $7.09 million and median sale prices at $4.80 million. Price per square foot averages $1,585.
Site Usability: Slope, Parking, and Driveway Access
The Baseline Hillside Ordinance governs grading volumes and floor area calculations on sloped terrain. Grading limits drive design choices such as stepping houses into slopes or using deeper foundations to avoid large pads. Retaining walls above certain heights need permits and engineered design, which adds costs and review time. Projects exporting soil need haul-route approval through the Bureau of Engineering and bonding for street restoration. Traffic control plans can add weeks to timelines.
Hillside streets range from wider collectors to limited streets with 20-foot minimum roadway width. Substandard hillside limited streets measure less than 36 feet wide or paved to less than 28 feet of roadway width. Fire department regulations need gates on private streets to leave 20 feet free and clear with adequate stacking space. Properties in Very High Fire Hazard Severity Zones must maintain year-round brush clearance within 200 feet of structures. Canyon homes with dual access or flat pad parking sell faster and closer to asking since buyers who tour multiple hillside properties recognize the operational advantage right away.
Investment Strategy: Views vs Operational Complexity
View premiums hinge on orientation and sightlines rather than simple presence of a vista. West and southwest exposures capture sunsets and evening city lights, often commanding premiums when unobstructed. Unobstructed panoramic sightlines price higher than partial or oblique views, with foreground composition mattering as much as distance. California law does not guarantee view protection unless recorded easements or covenants exist, creating risk on parcels with vacant or developable neighboring lots.
Dramatic, unobstructed landmark or ocean vistas can command premiums extending into high single digits to 20-30% in exceptional cases. Annual maintenance costs follow the 1-3% rule and need $100,000 to $300,000 yearly on $10 million properties. Property taxes run about 1.25%, insurance premiums range from $5,000 to $20,000 a year, and monthly utilities cost $500 to $2,000. Major hillside new builds with substantial soil export and discretionary review need 12 to 36 months from pre-application to final permit.
Bel Air: Estate Scale and Privacy Premium
Bel Air's 6.3 square miles shelter around 9,000 residents in estates where land scale determines hierarchy as much as architecture. The neighborhood functions as one of the most expensive neighborhoods in los angeles, yet operates through private networks where relationships built over years matter more than weeks of market exposure. Christina Pope at Sotheby's International Realty tracks these patterns through EliteResidenceInternational.com. She knows how terrain and privacy infrastructure create value layers invisible to casual observers.
Lot Size and Compound Potential (1.4 to 5+ Acres)
Smaller parcels in developed sections span quarter-acre to one-acre configurations. Multi-acre compounds concentrate along ridgelines and canyon floors like Stone Canyon and Upper Bel Air. Gated pockets and Bel Air Crest sections typically run 6,000 to 12,000 square feet, with homes from 2,500 to over 6,000 square feet. Custom-lot areas like Moraga and parts of East or West Gate often span 0.5 to 3+ acres. Trophy assemblages reach exceptional scale. One Kuwaiti billionaire's compound spans nearly 16 acres across nine parcels. An eight-acre promontory estate overlooks Bel Air Country Club and demonstrates the upper boundary where compound potential meets international buyer appetite.
Gated Living and Security Infrastructure
Full guard-gated communities feature 24/7 staffed entry with visitor controls and community patrols. Hybrid pockets use single manned entrances with roving security. Legacy estates rely on individual gates plus private security firms. Security services combine strategic patrols and access control with trained personnel to address unauthorized access, trespassing and privacy concerns. Gated infrastructure must accommodate emergency vehicles through approved entry systems or fail-safe mechanisms.
Price Positioning: $5M to $100M+ Transaction Range
Median list prices hit around $8 million per ZIP 90077 data. Estates regularly sell between $40 million and $50 million, in contrast. A Bel Air spec mansion recently cut its price below $100 million after testing the market at $139 million. The neighborhood's apex listing reached $400 million for an eight-acre compound with a 23-bedroom main house and 16-bedroom guesthouse.
Estate Management and Holding Period Considerations
New builds deliver modern systems and turnkey ease. Legacy estates offer mature grounds that need regular pruning, retaining wall maintenance and irrigation attention. Annual maintenance costs on mature trees, older equipment and unpredictable repairs create ongoing budget considerations. The right home makes all the difference if you love to entertain. I'd be delighted to help you find spaces designed for elevated living and effortless hosting if you're thinking over a purchase in the near future or beginning your search. Christina Pope  310-404-9931
  [email protected]
Submarket Variations: East Gate vs West Gate vs Upper Bel Air
East Gate near Sunset Boulevard and the country club core has the neighborhood's oldest and most notable estates on flatter to gently rolling terrain where usable grounds matter as much as the home itself. West Gate offers balanced estate character with more internal variety than the historic core. Upper Bel Air climbs toward Mulholland with the most topographic terrain, where buyers prioritize view exposure and privacy over flat yard space. Estates south of Mulholland, homes near the country club and canyon-view parcels attract different buyer pools and pricing dynamics.
Direct Comparison: Price, Lifestyle, and Investment Returns
Private negotiations set pricing in the most affluent neighborhoods in Los Angeles before properties reach public view. Christina Pope at Sotheby's International Realty tracks these patterns through EliteResidenceInternational.com, where timing and relationships determine outcomes more than market listings.
Median Price Analysis and What Your Budget Buys
Pacific Palisades post-fire transactions average $2.40 million, while Hollywood Hills median prices reach $2.00 million. Bel Air operates at a different scale, with median prices approaching $40.00 million. A $5 million budget secures rebuilt coastal property in the Palisades, architectural mid-century homes with partial views in the Hills, or entry-level gated estates in lower Bel Air.
Cap Rate Reality in the Three Markets
Westside single-family rentals deliver 2 to 3 percent cap rates. Pacific Palisades ranges from 4.5% to 5.5%, while small multifamily properties in affluent neighborhoods of all types in Los Angeles run 3.5 to 4.5 percent. Beverly Hills apartment buildings show cap rates between 3.5% and 5%.
Tenant Demographics and Rental Demand Patterns
Pacific Palisades households earn a median $174,406 annually, with 79.1% owner-occupied units and median gross rent at $3,096. Luxury rentals above $100,000 monthly exceed 250 active listings in wealthy neighborhoods throughout Los Angeles.
Appreciation Expectations by Neighborhood (2026-2031)
Bel Air posted 61% appreciation over eight years. Pacific Palisades saw 32% year-over-year growth pre-fire, with recovery projecting returns as inventory rebuilds through 2027.
Which Market Suits Your Investment Thesis
Cash flow investors favor Pacific Palisades' 4.5-5.5% returns. Appreciation-focused buyers accept Hollywood Hills' 2-3% cap rates to achieve long-term equity growth. Bel Air serves legacy wealth seeking privacy over immediate yield.
Practical Investment Strategy for High-Net-Worth Buyers
High-net-worth transactions in the most affluent neighborhoods in los angeles unfold through discretion rather than exposure. Precision matters more than visibility. Timing determines outcomes more than public marketing ever could. Christina Pope at Sotheby's International Realty guides these private channels through EliteResidenceInternational.com, where trusted relationships discover inventory before it reaches broader awareness.
Working with Agents Who Access Off-Market Inventory
Seventy percent of luxury transactions happen off-market, available only through connections. Agents maintain curated lists that require NDAs before sharing details. Hollywood Estates holds over $100 million in off-market inventory unknown to the broader agent community, while Carolwood Estates manages $1.3 billion in unlisted properties. Buyers demonstrate net worth credentials or cash-closing capability before getting access to whisper listings.
Due Diligence Essentials: Zoning, Permits, and Title Issues
Title searches verify ownership and identify liens or encumbrances that could transfer to new owners. California buyers receive 17 days on average to complete residential due diligence, though commercial properties allow 30-90 days. Zoning compliance checks confirm permitted uses, building code adherence, and Certificate of Occupancy verification. P.C.O.R. (Property Owner's Certificate and Request for Notice) and Natural Hazard Disclosure represent California-specific mandatory items.
California Mansion Tax Impact on Transactions Over $5M
Measure ULA adds 4% on sales between $5 million and $10 million, jumping to 5.5% above $10 million. Single-family sales above $5 million declined 68% compared to the prior year since April 1, 2023 implementation. A $12 million property incurs $480,000 in ULA tax alone. Beverly Hills and Pasadena remain exempt, while Santa Monica imposes 5.6% on transactions above $8 million.
Timing Your Entry in a Rate-Sensitive Environment
All-cash deals surged past 50% of transactions in the $5 million-plus range in markets like Manhattan and Miami. High-net-worth buyers focus on whether properties represent safe long-term wealth storage rather than rate fluctuations. Some buyers change to markets that offer relative value when rates rise.
Building Local Market Intelligence in Your Target Submarket
Local policies affect returns as much as pricing in wealthy neighborhoods in los angeles. Rent stabilization, tenant protections, and zoning rules vary by city and affect cash flow and eviction timelines. Successful investors prioritize neighborhood dynamics over countywide averages. The right home makes all the difference to those who love entertaining. I'd be delighted to help you find spaces designed to raise living standards and make hosting effortless if you're thinking over a purchase in the near future or beginning your search. Christina Pope 310-404-9931 [email protected]
Comparison Table
Pacific Palisades vs Hollywood Hills vs Bel Air: Investment Comparison Guide
Luxury real estate in Los Angeles isn't driven by headlines. Private conversations, timing and access shape it. The most meaningful transactions unfold within trusted circles, where discretion carries as much weight as value. Those who understand this world know that visibility is secondary to precision, and timing is everything.
Christina Pope — Sotheby's International Realty, EliteResidenceInternational.com
Detailed Neighborhood Comparison
| Attribute | Pacific Palisades | Hollywood Hills | Bel Air |
|---|---|---|---|
| Median/Average Price (2026) | $2.40M average (post-fire); $3.70M median listing | $1.849M median listing; $1.95M average value | $8M median list; $40M median sales |
| Price Range | $1.10M - $13.50M+ | $900K - $63M+ | $5M - $400M+ |
| Cap Rates | 4.5% - 5.5% | 2% - 3% (single-family rentals) | 2% - 3% (single-family rentals) |
| Historical Appreciation | 32% year-over-year (pre-fire) | Not specified | 61% over 8 years |
| Typical Lot Sizes | Not specified | Steep, terraced, narrow lots | 0.25 - 16 acres (compounds 1.4 - 5+ acres) |
| Architectural Styles | Mediterranean, Craftsman, Modern with retractable glass walls | Mid-century modern, canyon bungalows, post-and-beam designs | Custom estates, gated compounds (2,500 - 12,000+ sq ft) |
| Price Per Square Foot | Not specified | $824 median; $1,585 in Bird Streets | Not specified |
| Main Buyer Profile | Former residents with insurance proceeds (40% corporate entities), out-of-area buyers, investors/builders | All-cash buyers, global investors, equity-rich purchasers | Legacy wealth, international buyers, ultra-high-net-worth individuals |
| Key Features | Coastal location, infinity pools, ocean views, smart home automation, outdoor kitchens | Panoramic city/canyon views, architectural pedigree, hillside terrain | Estate scale, gated security, compound potential, mature grounds |
| Market Accessibility | Moderate (post-fire entry opportunities) | High (lowest entry point of the three) | Low (ultra-luxury tier) |
| Days to Pending | Not specified | 87 days average | Not specified |
| Sale-to-List Ratio | Not specified | 0.966 (96.6%); 73.7% sell below list | Not specified |
| Rental Demand | Median rent $3,096; 79.1% owner-occupied | Luxury rentals $100K+/month available | Luxury rentals $100K+/month available |
| Median Household Income | $174,406 | Not specified | Not specified |
| Main Risk Factors | Fire zones (all homes except one face major fire risk), insurance premiums increased 35-50%, FAIR Plan required ($30K-$60K a year) | Slope/topography challenges, view protection not guaranteed, hillside ordinance restrictions, fire hazard zones | Estate management complexity, mature property maintenance, longer holding periods |
| Unique Challenges | Fire clearance documentation, hillside grading review, permit status diligence, insurance coordination | Grading limits, retaining walls, haul-route approval, limited street access (20-36 ft width), parking constraints | Security infrastructure requirements, compound-scale maintenance, emergency vehicle access for gates |
| Investment Thesis | Cash flow focus with recovery appreciation potential | View-driven appreciation with operational complexity | Privacy premium and legacy wealth preservation |
| Inventory Status (Q1 2026) | 60% below pre-fire average (316 active listings) | 325 active listings | Limited (operates mostly off-market) |
| Off-Market Transaction Rate | ~20% (properties $20M+) | ~20% (properties $20M+) | ~70% of luxury transactions |
| Notable Submarkets | Riviera, Huntington | Bird Streets ($13.16M avg; $4.80M median) | East Gate, West Gate, Upper Bel Air |
The right home makes all the difference if you love to entertain. I'd be delighted to help you find spaces designed for elevated living and effortless hosting if you're thinking about a purchase in the near future or beginning your search.
Christina Pope 310-404-9931 [email protected]
Conclusion
Pacific Palisades, Hollywood Hills, and Bel Air represent three distinct investment theses, not interchangeable luxury markets. Pacific Palisades delivers the strongest cash flow at 4.5-5.5% cap rates with post-fire entry opportunities. Hollywood Hills offers pricing from $1.849 million with view-driven appreciation potential, balanced against topography constraints. Bel Air operates at estate scale. Privacy commands premiums there, and legacy wealth accepts 2-3% returns for discretion.
Your capital allocation should reflect priorities. Cash flow favors the Palisades. Appreciation potential suits the Hills, and privacy premium defines Bel Air. Each market rewards different investment horizons and operational tolerances. Christina Pope can guide you through the off-market inventory in all three neighborhoods. Reach her at 310-404-9931 or [email protected].
Key Takeaways
Los Angeles' most affluent neighborhoods operate through private networks where timing and relationships matter more than public listings. Here's what savvy investors need to know about Pacific Palisades, Hollywood Hills, and Bel Air:
• Pacific Palisades offers the strongest cash flow potential at 4.5-5.5% cap rates, with post-fire recovery creating rare entry opportunities at $2.40M average prices versus historical $5.5M medians.
• Hollywood Hills provides the most accessible entry point at $1.849M median, delivering view-driven appreciation despite topography challenges and operational complexity from steep terrain.
• Bel Air operates at estate scale ($8M-$40M range) where privacy commands premium pricing, attracting legacy wealth willing to accept 2-3% returns for discretion and compound potential.
• Off-market transactions dominate luxury sales at 70% rates, requiring established agent relationships and NDA-protected access to inventory that never reaches public view.
• California's Mansion Tax adds 4-5.5% on sales above $5M, causing 68% decline in luxury transactions since 2023 implementation and reshaping buyer strategies toward all-cash deals.
Each neighborhood rewards different investment priorities: choose Palisades for cash flow, Hollywood Hills for appreciation potential, and Bel Air for privacy premium. Success depends on matching your capital allocation strategy with the specific market dynamics of your target area.
FAQs
Q1. Which Los Angeles neighborhoods attract the most billionaires? Billionaires in Los Angeles concentrate in Beverly Hills, Bel Air, and Malibu's exclusive coastal enclaves. These areas provide exceptional privacy, luxury amenities, and often panoramic views that appeal to tech executives, entertainment industry leaders, and ultra-high-net-worth individuals seeking discretion alongside prestige.
Q2. Is Bel Air or Beverly Hills considered more affluent? Bel Air operates at a higher price tier than most Beverly Hills sections, with median sales approaching $40 million compared to Beverly Hills Gateway's $13 million median. Bel Air's estate-scale properties spanning 1.4 to 5+ acres and compound potential attract legacy wealth prioritizing privacy over accessibility, while Beverly Hills offers more varied price points and commercial proximity.
Q3. What defines the wealthiest neighborhoods in Los Angeles? The wealthiest Los Angeles neighborhoods include Beverly Hills Gateway, Bel Air Estates, Holmby Hills, Pacific Palisades, and Hidden Hills. These areas feature luxurious properties with significant land holdings, exclusive gated communities, high-profile residents, and median home values ranging from $5.5 million to over $40 million depending on the specific enclave.
Q4. How do off-market sales affect pricing in luxury LA neighborhoods? Off-market transactions represent approximately 70% of luxury sales in Los Angeles' most affluent areas, fundamentally altering pricing dynamics. While MLS-listed properties sell for 13% more on average, many sellers accept this discount specifically for privacy and timing control, creating a parallel market where discretion carries equal weight with financial returns.
Q5. What are the typical investment returns in Pacific Palisades, Hollywood Hills, and Bel Air? Pacific Palisades delivers the strongest cash flow at 4.5-5.5% cap rates with post-fire recovery potential. Hollywood Hills offers 2-3% returns focused on view-driven appreciation despite operational complexity. Bel Air provides similar 2-3% yields where legacy wealth accepts lower immediate returns in exchange for privacy, estate scale, and long-term value preservation.